Bird Classification

Ryan Mathew and Kevin Khuu

Learn More!

Problem Description

The problem we were trying to solve was, given an image of a bird, to identify what species it belongs to. We needed to distinguish between 555 different species of birds ranging from hawks, eagles, owls, ducks, geese, and many more. We also needed to ensure that we had a reasonable accuracy (~80%) in our predictions of bird species. We trained and tested our model through a Kaggle competition.

Previous Work, Approach

Our approach was to utilize Convolutional Neural Networks (CNNs), Transfer learning, Data Augmentation, and Parameter Fine tuning. This involved initializing our network with a pretrained model as a feature extractor, and then training it on our transformed/augmented birds dataset. Our initial code layout was from Professor Joseph Redmon’s tutorial on transfer learning applied to bird classification, which can be found here.

  1. We experimented with multiple pretrained models including ResNet18, ResNet152 (limited epochs), MobileNetv2, EfficientNetb3, and densenet161 to find the best feature-extracting network for our problem. We noticed that because these models were trained on datasets like ImageNet--which includes thousands of images with numerous objects--we would already have a better-than-decent feature extracting model as a starting point. However, we also noticed that our problem was a bit more specific than object detection within images. We believed that since we were distinguishing between a large number of bird species, the best pretrained models would be the ones that extracted more features (a larger output layer). We thought this because a fair amount of the bird species in our datasets were similar in shape and body structure (especially the smaller birds, which are harder to distinguish). It made sense to us that increasing the number of features would enable the model to be more confident (return a higher likelihood) in its predictions of closely-looking, but different, bird species. For example, if there were many features relating to the shape or structure of a bird (which can be similar among many species of birds), adding more features might make it helpful to discern between more specific characteristics (e.g., beak length, color and color variations, body part positions on the body (ex. where the eye is)). We adjusted and tried the different models based on this assumption (model with more features => better results). This is also just a good rule of thumb for most image classification tasks. Note: We were somewhat limited by Google Colab’s (the programming interface we used) GPU usage policy and couldn’t use models that had very large layers/features.

  2. In addition to finding the best pretrained model, we updated the preexisting image transformer code to fit various pretrained model specifications and to produce better results. We first transformed the images by resizing them to 256x256 resolution. Then, since we noticed in the images that the birds were typically placed near the center, we cropped them to 224x224. We chose this number because the models were trained to expect images of this size. Training images would also be randomly flipped horizontally so that we would reduce overfitting, and on some models, we normalized the images.

  3. Lastly, we fine-tuned our best models by adjusting hyperparameters. Specifically, we added a decay (dividing by a rate of two) for our learning rate to start decreasing it at certain epochs. This included implementing a new scheduler and would accelerate training/reduce overfitting. We saw this in action from the model described by this bird classification article here. We didn’t want to decrease the learning rate too much though, because that could lead to worse performance (see this article here). We also increased the epochs minimally and progressively as we switched to better models to give our models more time to train. Note: We were limited to about 10 epochs as the max for a model because of the GPU constraints mentioned above. Progressive iterations were necessary to find the best model because training took a long time for higher epochs (~3 hours).

Results


ResNet18

  • Trained on the birds dataset for 5 epochs
  • Learning rate was set at a constant .01
  • Accuracy was not that high
  • Served as a good baseline for the rest of our models
Losses:
ResNet18 Losses Graph

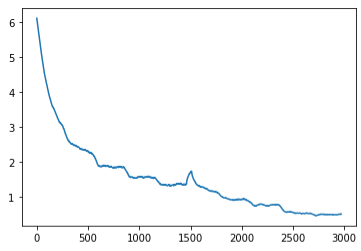
Test accuracy: 67.9%

MobileNetv2

  • Trained for 10 epochs
  • Scheduled learning rate to decrease by a factor of 2 from .01 starting at the 5th epoch
  • Outperformed ResNet18 with accuracy of 77.6%
Losses:
MobileNetv2 Losses Graph

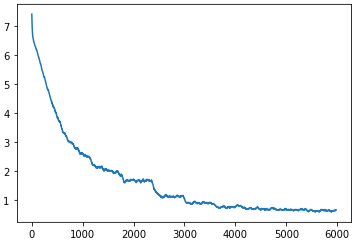
Test accuracy: 77.6%


EfficientNetb3

  • Trained for 10 epochs
  • Scheduled learning rate to decrease from .01 to .001 after 5 epochs,
    then to .0001 after 3 more
  • Outperformed ResNet18 with accuracy of 74.9%
Losses:
EfficientNetb3 Losses Graph

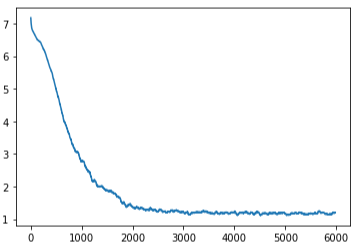
Test accuracy: 74.9%

densenet161

  • Trained for 10 epochs
  • Scheduled learning rate to decrease by a factor of 2 from .01 starting at the 5th epoch
  • Achieved our best accuracy of 85.2%
Losses:
densenet161 Losses Graph

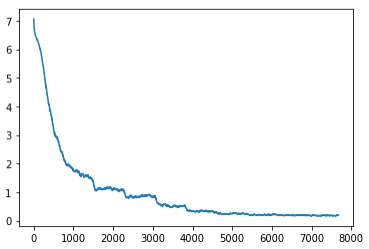
Test accuracy: 85.2% (Top 5 on leaderboards)

Datasets

The datasets we used were the ones provided by the Kaggle competition and can be found here.

Discussion

What problems did you encounter?

  1. Google Colab had a GPU limit so we could not train for long periods of time without saving a checkpoint and starting again when the GPU availability timer reset. This limited how long we could train for and how many models we could test.

  2. We had some trouble figuring out how we should change certain parameters to best fit the data without overfitting (ex. learning rate, epochs).

Are there next steps you would take if you kept working on the project?

  1. Since we were limited in time, we would like to try taking some of the models that we tested further (more experimenting with parameters, more epochs). Additionally, we would also like to try pretrained models with more features to see if our assumption still holds (such as RegNet and later versions of EfficientNet). We weren’t able to do this because of Google Colab limits.

How does your approach differ from others? Was that beneficial?

  1. Our approach was spreading our time and effort across several different models, rather than overly investing in one. We think that this method worked out well and saw its benefits from our data. For example, at around 5 epochs for some models, we noticed that the loss was already plateauing. This is seen in all the visualizations of losses, where their value becomes stagnant near the end. This makes us believe that even if we had taken 20 or even 30 epochs for a model, the accuracy and outcomes wouldn’t have changed drastically. Additionally, looking at the results of all our models, we can see that the differences in accuracy were quite significant, with a range of 17.3%. Therefore, it was much more important to prioritize finding a model that fit our problem best, rather than optimizing any one model.

Demo